Simplify the management of your organization's locations, vehicles, and IoT devices with NetCloud
Organizations are turning to 5G to interconnect their branch/remote offices, IoT devices, and vehicle fleets due to many factors including increased performance as 5G infrastructure continues to be built out, the ability for 5G to reach “hard to wire” areas, and faster time to service with the ability to connect a new location as soon as the Wireless WAN router is in place.
In addition to leading 5G routers or adapters, Cradlepoint also provides the tools to simplify the deployment of 5G through NetCloud Manager, our management, orchestration, and endpoint control platform for Wireless WANs. The NetCloud Service leverages Cradlepoint’s rich five-year history of providing cellular insights and intelligence for 3G/4G/LTE networks to bring about enhanced capabilities for 5G rollouts.
Check out our NetCloud Service webpage or register for a demo for details on how NetCloud can simplify, visualize, and secure your cellular or hybrid network.
What features are included in NetCloud Cellular Intelligence for 5G?
NetCloud Cellular Intelligence for 5G includes a live view of 5G cellular health; 5G data usages tracking and forecasting; location tracking with integrated 5G coverage maps; speed and performance validation over 5G; and a health and reporting dashboard. Let's explore these feature in detail.
1. Live view of 5G cellular health – a game changer for troubleshooting
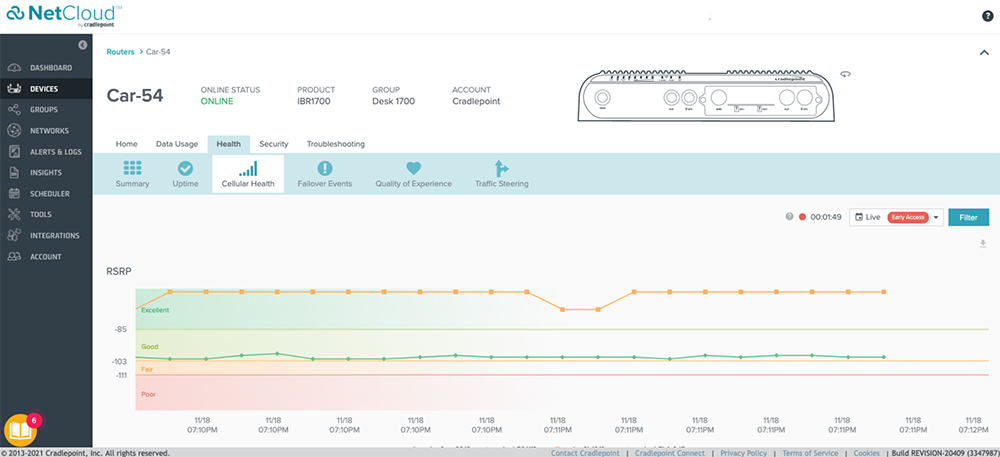
Having a real-time view of the signal strength and the signal quality coming from the router/ adapter is a game changer in troubleshooting performance and connectivity issues. Many cloud management platforms have data polling intervals at 15 minutes, which can complicate troubleshooting since the management layer is then out of sync with what is happening in real-time with the cellular connection.
NetCloud, provides a real-time view of cellular health. As part of the health tab on the router/ modem dashboard, the cellular health card provides a live view of the signal quality (SINR, RSRQ, RSRP, EC/lo, RSSI) and signal strength (RSSI). In addition to viewing the signal quality in real time, it is possible to provide a historical view over pre-defined or customizable ranges.
Note that to see the live stats, customers must be running NCOS 7.21.91.
What it looks like?

2. 5G data usage tracking and forecasting – making sure you never have an overage
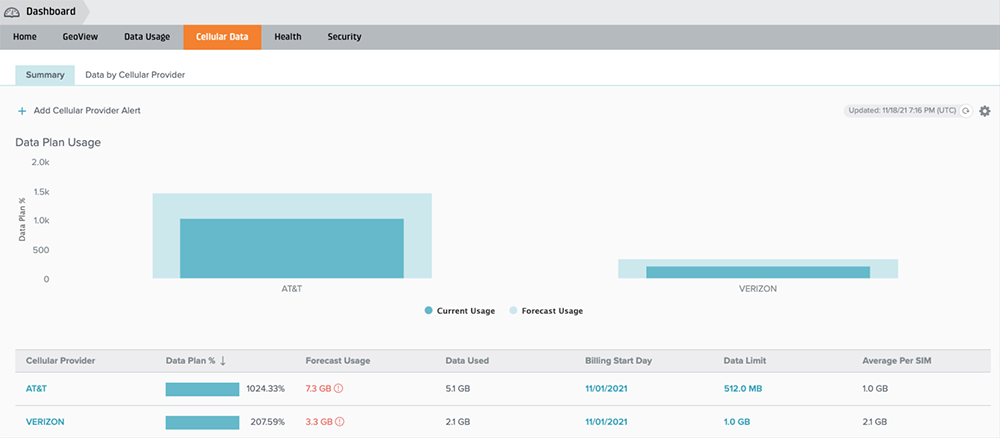
When leveraging cellular connectivity, a common concern is how to track and forecast data usage to prevent costly overages. Managing this across thousands of connections, multiple carriers, and different billing cycles can be very complex. NetCloud simplifies all this, providing tracking, forecasting, graphs, and alerts on data usage pooled across all your routers associated to a particular account, or for just a single router.
Powerful ML/AI capabilities forecast your data usage based on current usage patterns. To ensure you never have an overage, alerts can be set up to inform you when you have reached a certain data usage threshold on pooled accounts for a single carrier and/or on just a single router.
What it looks like? For existing customers, although the dashboard name has changed from Modem Usage to Cellular Data and a more modern UI is being used, all the tracking, forecasting, graphing, and alerting capabilities remain the same.

3. Location tracking with integrated 5G coverage maps
In vehicles, where a router is almost always moving, that signal is ever-changing and potentially dropping out of coverage range. Those dropouts or "dead spots" can become very problematic if the user’s mission-critical applications begin suffering interruptions.
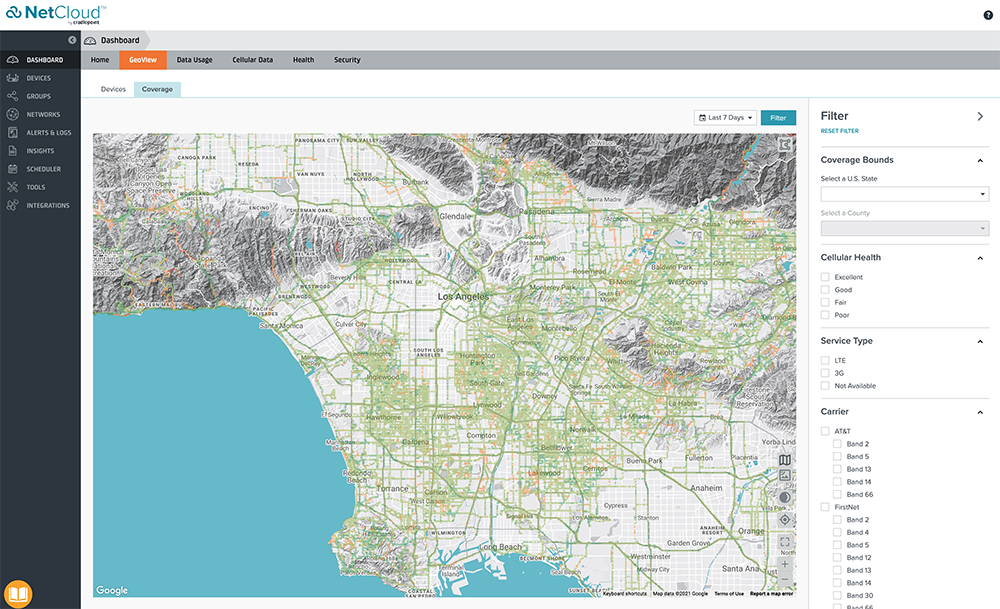
NetCloud GeoView is a suite of features that uses GPS and cellular health to provide a system administrator with usable analytics about the location and signal strength of its vehicles. It enables administrators to track the location of vehicle fleets (even through unavoidable dead zones such as tunnels) while also viewing the health of available 5G cellular coverage across their entire region. This allows organizations to try and avoid coverage gaps on major routes and/or request additional coverage from their carrier where required.
NetCloud GeoView provides the following three insights:
Location services: Provides a real-time view of the location of the various routers.
Location tracking: Offers a historical view of a vehicle’s route over a set period.
Coverage Map: Integrated heatmap that allows you to view the cellular health of your endpoints in an intuitive, visual way. It allows for a quick comparison of cellular health between carriers and between bands.

4. Validating speed and performance over 5G for a high quality of experiences
Speed tests are a valuable tool in providing quick validation of cellular WAN performance in installations and in troubleshooting, as well as providing validation of the carrier service type. For example, validating whether an endpoint is connected to an LTE or 5G service.
What’s New?
- Mobile and Verify Applications: We have redesigned the speed test on our Mobile and Verify installation applications to be optimized for 5G services. This means we can test higher- speed services, deliver greater accuracy in our results, and measure latency and jitter in addition to download and upload throughput.
- NetCloud Manager: In addition to the 5G-optimized speed test described above, which has been generally available for a few months, the browser-based version of NetCloud will soon offer the ability to store speed test results. This will provide a historical reference to identify trends in cellular performance.
5. Health dashboard with a new reporting function to make sure you don't miss a thing
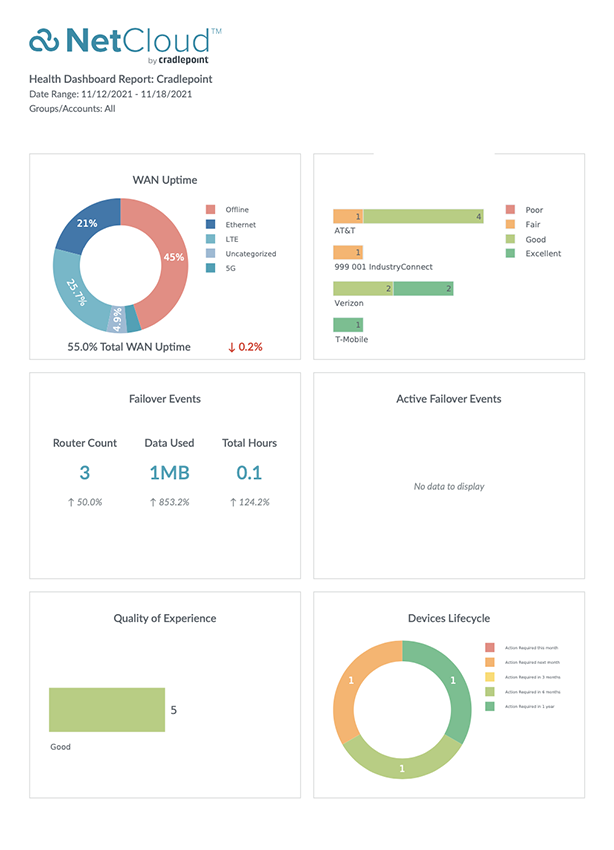
The health dashboard provides valuable at-a-glance insights into the overall function of your Wireless WAN network. With a variety of metrics including WAN uptime, cellular health, failover events, device lifecycle, and more, having this consolidated view gives administrators the opportunity to see where any potential issues might be so you can drill down and get more details or proactively fine tune the network to ensure consistent performance.
What’s New? Now available is the ability to download from a snapshot the health dashboard that can be converted into a PDF. This PDF can also be emailed at a regular cadence, or on demand, to multiple NetCloud users. The main benefit is administrators can get reports emailed first thing in the morning (or anytime) so they can get a consolidated view of their network health without ever having to log in.
What it looks like? Example pdf report from the health dashboard

